Fall 2011 to Spring 2012
Fall 2012 to Spring 2013
Fall 2013 to Spring 2014
Fall 2014 to Spring 2015
Cambridge, Maria L. Baldwin School, Grade 5
Instructional Materials:
Investigations in Number, Data and Space, Grade 5, Unit 9
How Long Can You Stand on One Foot?
Sessions 1.1—1.4
The focus of the curriculum in this class was data collection, representation, and analysis. The first several lessons revolve around a data collection activity to investigate the length of time people can stand on one foot with their eyes closed. Students compare their own balancing time on right and left feet, then compare their balancing data with that of students in another fifth grade class (provided with the curriculum) and adults from whom they collect data at home.
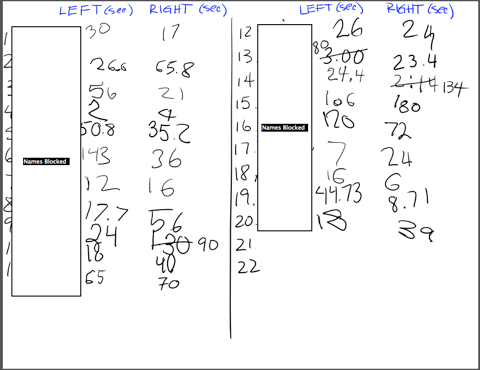
The curriculum design calls for the entire class to collaboratively create two large line plots to display their data, one each for left and right foot. Students call out their results and the teacher marks the values on the line plots; when the line plots are complete, students discuss the data. We decided to have students create their own line plots on their tablets and have the teacher choose several to display as a basis for discussion. In order to make the data visible to everyone, we had students write their balancing times (in seconds) on the teacher's tablet so that all of the data were projected, as shown in Figure 1. (Students' names have been blocked out to protect anonymity.)
Figure 1: Student data from balancing on one foot, as collected on the teacher's tablet.
Several students, however, had trouble copying the data from the projected display onto the line plot on their tablets, so the next day we provided each student with a paper copy of the data. This solved the "I can't see the data" problem, but we discovered another issue: The tablets were too small for some students to comfortably make a line plot, especially if they had large handwriting and/or wanted to label many values along the axis. Some students had creative solutions to the lack of space, such as Figure 2. This student divided each line plot into three large (non-equal) segments and created a histogram-like graph.
Figure 2: Student representation of balancing data.
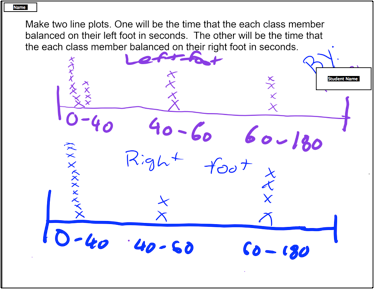
Some students broke their line plots into two parts, drawn on two separate lines, as in Figure 3.
Figure 3: Student representation of balancing data.
Other students chose to make their line plots on a blank tablet page to gain more room, and one boy refused to use the tablet, instead drawing his graphs on regular paper, which was slightly larger than the tablet screen.
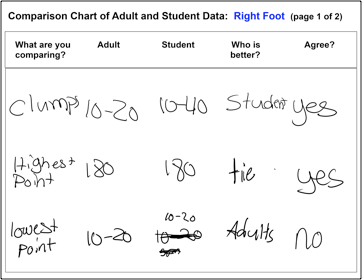
In contrast to the problems students had drawing data representations on the limited size of the tablet screen, the next activity, which involved their comparing students and adults on their balancing ability, fit the tablet well. One student's answers to these questions, shown below in Figure 4, illustrate the structure of this part of the lesson. Note the final column, in which the student is supposed to check his or her answer with a partner; it would be interesting to know the story behind the set of answers in the last row.
Figure 4: Student work comparing balancing data from adults and students.

The teacher was able to display several students' answers to these comparison questions at the same time and lead a discussion about the criteria students used to decide which group was better at balancing.
Our residency in this class highlighted issues about the process of using tablets to implement a paper-based curriculum. A recurring issue has been that of screen real estate—the tablet screen is smaller than an 8.5 x 11 sheet of paper, and students tend to write somewhat larger on the tablet than they do on paper. As a result, it is not always possible to simply "copy" what is on a paper-based student sheet to the tablet screen. The next version of CLP will have scrolling pages, which will help in some cases, but there is no substitute for physical space. It seems that both hardware manufacturers and the consumer public are moving toward smaller hand-held devices for education (although, simultaneously, we are moving toward larger TV screens) with little thought about how that form factor will impact students' experiences.